Chart for .NET Windows Forms is a charting tool for Windows Forms applications. It is a .NET control written in C# 2.0 and integrates into Visual Studio to provide developers with powerful data visualization capabilities. Chart for Windows Forms supports 2D chart types, provides data binding capabilities, and offers some chart elements like customizable titles and legends. You can bind data from virtually any data source, so that your customers can enjoy seeing their business data displayed in graphs. It doesn't matter if the data comes from an OLAP source or binary file - you can feed it to Chart anyway.
Chart for .NET Windows Forms is a charting tool for Windows Forms applications. It is a .NET control written in C# 2.0 and integrates into Visual Studio to provide developers with powerful data visualization capabilities. Chart for Windows Forms supports 2D chart types, provides data binding capabilities, and offers some chart elements like customizable titles and legends. You can bind data from virtually any data source, so that your customers can enjoy seeing their business data displayed in graphs. It doesn't matter if the data comes from an OLAP source or binary file - you can feed it to Chart anyway.
The key moment about Chart for Windows Forms is that it can be used by any Windows Forms developer, not just OLAP-related. In fact, this is a kind of secondary product, and it can be used to visualize data from any data source, and by developers from virtually any subject field. This means that the market of the product is much larger than just Business or OLAP applications.
One of the most impressive features of the Chart is that it can display data from TOLAPGrid control (that is a part of RadarCube for Windows Chart OLAP tool). If this is the case, users of the Chart can experience additional functionality like drilling down to chart values, inherited value labels, and so on. However it can be perfectly used like an ordinary charting tool for displaying any data using the advanced graphics GDI+ technologies like alpha blending, gradients, and anti-aliasing.
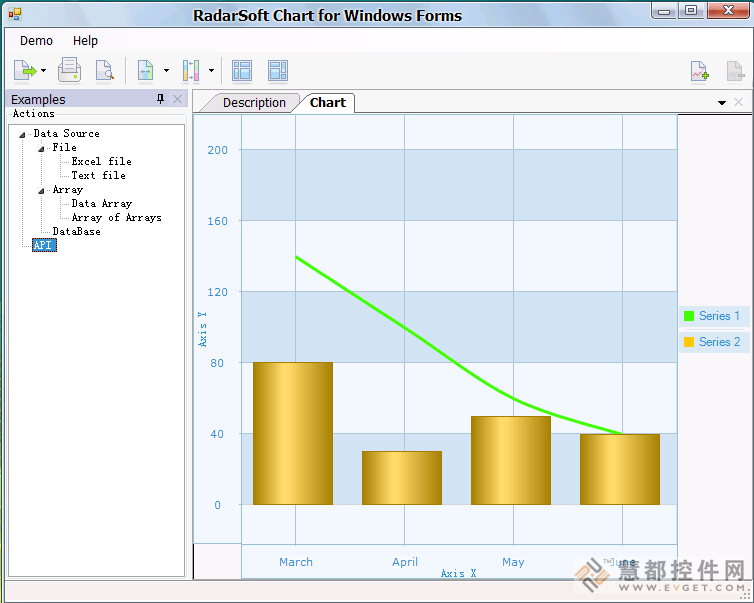
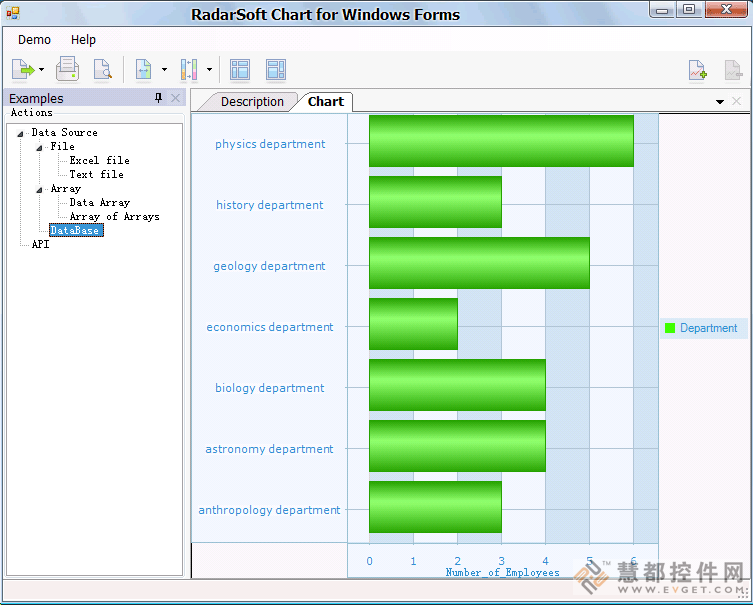
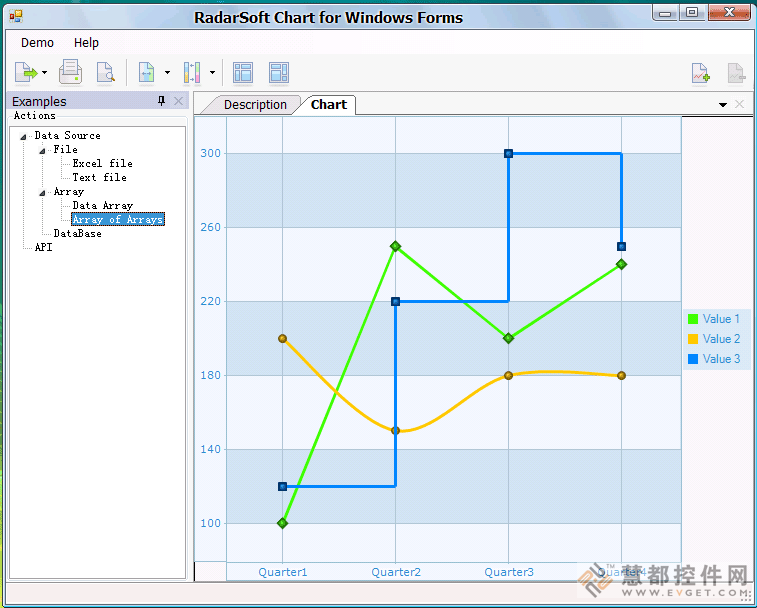
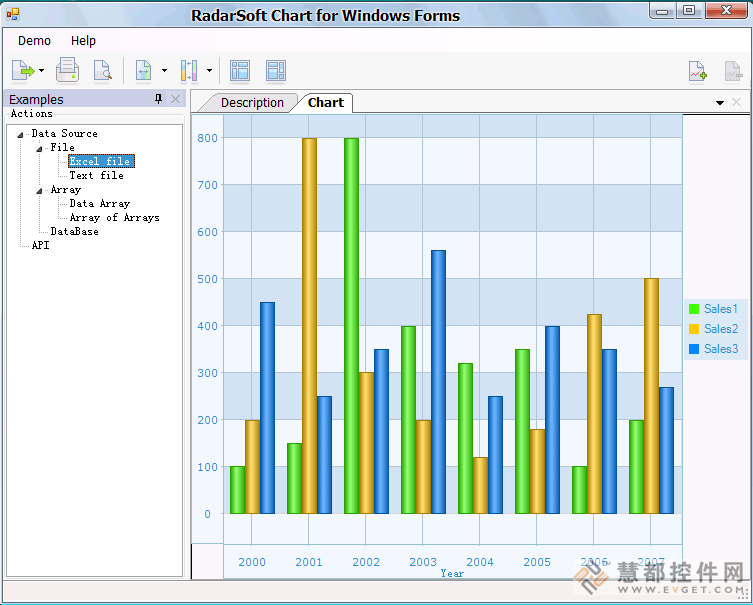
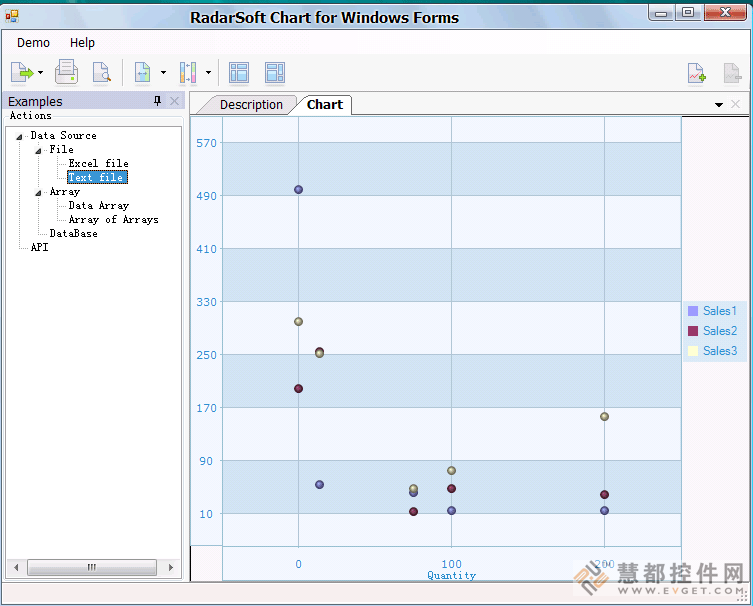
Data Source
You can populate the chart with any data that you have access to: Text files, MS Excel file, data base, or any other data array. If the TOLAPGrid component (which is a part of RadarCube for Windows Chart OLAP tool) is used as a data source then the users can experience additional functionality like drilling down to chart values, inherited value labels, and so on.
Design Time Data Binding
Data binding provides a simple way to populate chart data from one of many possible .NET Data Sources. You can do it right from within Visual Studio, so that not a single line of code has to be written. It is fast, easy and flexible way to populate the chart with data.
Chart Types
Several chart types are supported including Line (Spline, Step), Bar, and Point.
Chart Elements
Chart supports the main elements including Layers, Series, Legends, and Points. Every element can be customized and tuned.
Chart look and feel
Chart has fully customizable visual interface with changeable colors, fonts, and so on. In addition to the built-in schemes (skins), a developer may tune his own skin that can give the chart a unique look and feel.
Export
Chart for Windows Forms provides the built-in support of data exporting to the variety of formats including JPG, TIFF, GIF, and so on.
The key moment about Chart for Windows Forms is that it can be used by any Windows Forms developer, not just OLAP-related. In fact, this is a kind of secondary product, and it can be used to visualize data from any data source, and by developers from virtually any subject field. This means that the market of the product is much larger than just Business or OLAP applications.
One of the most impressive features of the Chart is that it can display data from TOLAPGrid control (that is a part of RadarCube for Windows Chart OLAP tool). If this is the case, users of the Chart can experience additional functionality like drilling down to chart values, inherited value labels, and so on. However it can be perfectly used like an ordinary charting tool for displaying any data using the advanced graphics GDI+ technologies like alpha blending, gradients, and anti-aliasing.
Data Source
You can populate the chart with any data that you have access to: Text files, MS Excel file, data base, or any other data array. If the TOLAPGrid component (which is a part of RadarCube for Windows Chart OLAP tool) is used as a data source then the users can experience additional functionality like drilling down to chart values, inherited value labels, and so on.
Design Time Data Binding
Data binding provides a simple way to populate chart data from one of many possible .NET Data Sources. You can do it right from within Visual Studio, so that not a single line of code has to be written. It is fast, easy and flexible way to populate the chart with data.
Chart Types
Several chart types are supported including Line (Spline, Step), Bar, and Point.
Chart Elements
Chart supports the main elements including Layers, Series, Legends, and Points. Every element can be customized and tuned.
Chart look and feel
Chart has fully customizable visual interface with changeable colors, fonts, and so on. In addition to the built-in schemes (skins), a developer may tune his own skin that can give the chart a unique look and feel.
Export
Chart for Windows Forms provides the built-in support of data exporting to the variety of formats including JPG, TIFF, GIF, and so on.


 首页
首页 


 相关产品
相关产品 授权相关问题
 微信
微信 在线咨询
在线咨询


 渝公网安备
50010702500608号
渝公网安备
50010702500608号

 客服热线
客服热线